Microarrays can be fabricated in many forms and can contain up to hundreds of thousands of probes that target tens to thousands of genes. Multiple probes are typically designed for a target geneA segment of DNA containing the code for a protein, transfer RNA, or ribosomal RNA molecule (based on Madigan et al. 2010). and the number of probes exceeds the number of target genes.
Additional information is available in the Microarrays Fact Sheet.
DNA typically is found as a double stranded molecule in which the sequence of nucleotide bases on one strand (for instance, ATCG) has a complementary sequence (TAGC) on the opposite strand. If two complementary DNA strands are mixed together in solution, they tend to join together (hybridize) and form a stable double-stranded molecule by hydrogen bonding. The degree of hybridization between the two strands is dictated by base-pairing rules (for example, A on one strand always binds to T on the other strand) and the specific sequence of bases in the two strands. Two DNA strands with complementary base sequences will bind together tightly, while dissimilar strands will bind together poorly, if at all.
Microarrays exploit this hybridization effect to detect the presence of DNA sequences for specific genes in environmental samples by using short, single-stranded DNA molecules (probes) with known nucleotide sequences. In practice, these probes are attached to a solid surface such as a glass slide or suspended in a gel. After extracting DNA from an environmental sample (and sometimes amplifying the DNA by PCR), the DNA sample is labeled with a fluorescent dye and applied to the array. When hybridization occurs, the labeled DNA that complements the microarray probesShort, defined segments of DNA that are designed to bind with the target gene if found in the environmental sample. The probes are attached to the solid surface of the microarray. are retained on the slide, producing a characteristic fluorescent signal. DNA that does not have a complementary probe on the microarrayDetects and estimates the relative abundances of hundreds to thousands of genes simultaneously. slide does not bind (hybridize) and is removed in a washing step. Detection and relative quantification of specific genes in the DNA sample is based on the strength of the fluorescent signal that remains on the microarray after the washing step. Some microarrays use two fluorescent dyes (often red and green), which can be used to compare the range of genes present in more than one sample (Figure 6-1). Figure 6-1 shows a generic microarray analysis. DNA is isolated from groundwater collected within and outside of a contaminant groundwater plume. The DNA is labeled with two fluorescent dyes (green and red) and hybridized to the microarray. After multiple washing steps, the microarray slides are analyzed with a high-resolution laser scanner.
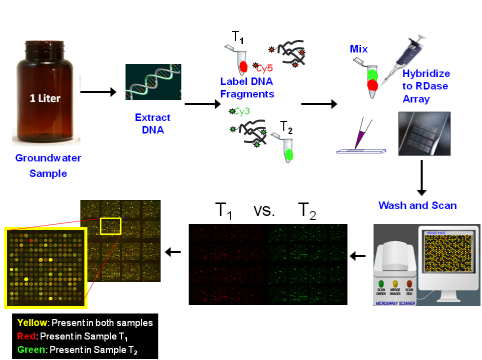
Figure 6-1. Generic microarray analysis.
Source: E. Padilla-Crespo and F. Löffler, Ph.D., University of Tennessee, 2012. Used with permission.
Microarrays can be fabricated in many forms and can contain up to hundreds of thousands of probes that target tens to thousands of genes. In high-density microarrays, the position and nucleotide sequence of each probe on the microarray is precisely known, and the fluorescence associated with each probe can be located and measured using laser excitation and detection. The benefit of high-density microarrays is that they can rapidly and simultaneously determine the presence and abundance of numerous genes in a single DNA sample using identical analytical conditions.
Microarrays have been used for environmental research for at least 15 years but have become commercially available to a wider community only recently. The commercially available Affymetrix Phylochip® microarray contains a comprehensive suite of probes for bacterial 16S rRNAA subunit of the ribosome composed of ribonucleic acid (RNA). The RNA sequence is used to classify and identify microorganisms (e.g. genus and species). genes, a stretch of DNA sequence that by convention acts as the "bar code" for bacterial identification. This microarray can therefore provide comprehensive information about microbial communityThe microorganisms present in a particular sample. structure and can answer the question “Which microorganisms are present?” (Conrad et al. 2010; Briggs et al. 2011; Cooper et al. 2011; DeAngelis et al. 2011; Mendes et al. 2011).
Another commercially available microarray, GeoChip, contains approximately 28,000 probes that target nearly 57,000 gene variants. These targeted gene variants are implicated in major microbial processes such as contaminant degradation, carbon, nitrogen, sulfur and phosphorous metabolism, metal reduction and antibiotic resistance (He et al. 2007; He et al. 2010; He et al. 2011; Zhou et al. 2011). The GeoChip thus addresses the question “What can the microbes that are present potentially do?” and, if used as an expression array for transcript analysis, can answer the question: “What are the microbes that are present actually doing?”.
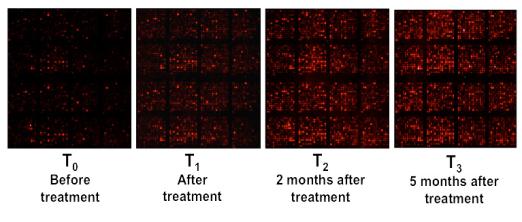
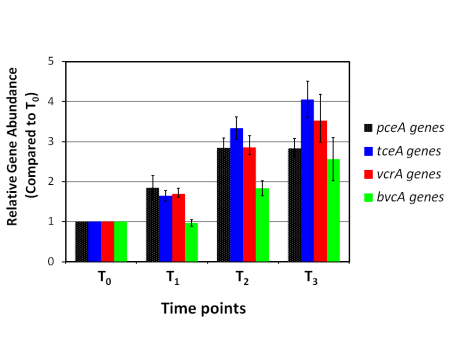
If applied to DNA samples collected over time from the same sampling locations, DNA microarrays can monitor changes in community structure and functional gene content in response to treatment such as biostimulation. Microarrays can also be used to investigate which genes are being expressed by microorganisms. This information can be used to answer questions such as “Which organisms are active?” and “What metabolic pathways are these organisms using?” These questions are addressed using expression microarrays, which require extracting mRNA from environmental samples and then converting this mRNA to complementary DNA (cDNA) in the laboratory. The cDNA is then analyzed the same way as DNA directly extracted from an environmental sample. If applied to RNA samples collected over time from the same sampling locations, expression microarrays can also monitor changes in levels of gene expression in response to treatments such as biostimulation.
Site characterization, remediation, monitoring, and site closure require thorough examination of available chemical, geochemical, and microbiological data. The purpose of performing DNA or RNA microarray analyses is to provide the microbiological lines of evidence: the presence (semi-quantitative) and activityRefers to when a microorganism performs a specific function (e.g., sulfate reduction, metabolism of benzene) of microorganisms capable of biodegradationA process by which microorganisms transform or alter (through metabolic or enzymatic action) the structure of chemicals introduced into the environment (USEPA 2011). of the relevant contaminants or the biogeochemical processes that support biodegradation at a given site.
|
Title |
General information |
Contaminants |
EMDs used |
Project life cycle stage |
|---|---|---|---|---|
|
In Situ Uranium Reduction, CO (see description below) |
In situ uranium bioremediationThe treatment of environmental contamination through the use of techniques that rely on biodegradation. Bioremediation has two essential components: biostimulation and bioaugmentation., key functional genes were studied with GeoChip |
Uranium |
GeoChip Functional genes that reflect redox conditionsDescription of the oxidation/reduction potential of the subsurface (e.g. aerobic, anaerobic, sulfate reducing, or methanogenic conditions) |
Characterization and Remediation |
|
High-density PhyloChip profiling of stimulated aquifer microbial communities (see description below). |
Determine community membership for uranium bioremediation experiments |
Uranium |
PhyloChip |
Characterization and Remediation |
|
Deep Sea Oil Plume (see description below). |
Understanding the microbial community functional composition |
Crude Oil |
GeoChip Functional Genes that reflect oil remediation |
Characterization |
|
Deep Sea Oil Plume (see description below) |
Understanding the petroleum degrading microorganisms |
Crude Oil |
GeoChip and PhyloChip |
Characterization |
|
Monitoring microbial community structure (see Appendix A.10) |
Application of a field-portable microarray system |
Uranium |
TruArray® BER |
Characterization and Remediation |
To better understand the microbial functional diversity changes with subsurface redox conditions during in situ uranium bioremediation, key functional genes were studied with GeoChip, a comprehensive functional gene microarray, in field experiments at a uranium mill tailings remedial action (UMTRA) site in Rifle, CO (Liang et al. 2012).
Samples were taken from both laboratory and field experiments from the Department of Energy Integrated Field Research Challenge Site (IFRC) in Rifle, Colorado. The analyses were done to determine community composition and population patterns among a set of samples associated with uranium bioremediation experiments. The high-density microarray (PhyloChip) samples were collected from unstimulated and naturally reducing sediments, or collected during acetate donor stimulated Fe(III) and sulfate reduction (Handley et al. 2012).
In this paper the authors showed how microbial community functional composition and population structure were altered in an oil spill in the Gulf of Mexico. Until this time the impacts on marine ecosystems were largely unknown. In the spill area a variety of metabolic genes involved in both aerobic and anaerobic degradation of petroleum hydrocarbons were highly enriched compared with areas outside the spill. This indicates potential for intrinsic bioremediation or natural attenuation in the deep sea (Lu et al. 2012).
In this research effort the authors use various array data to show that the dispersed hydrocarbon plume stimulated deep-sea indigenous γ-ProteobacteriaA broad phylum of gram negative bacteria that is categorized into six groups, involving many genera, based on 16s rRNA differences that are closely related to known petroleum degraders. The hydrocarbon-degrading genes identified coincided with the concentration of various oil contaminants. Incubation experiments with environmental isolates also demonstrated faster-than-expected hydrocarbon biodegradation rates at low temperatures (5°C) showing the potential exists for intrinsic bioremediation of the oil plume in the deep-water column (Hazen et al. 2010).
Microarrays can perform thousands to millions of hybridization reactions simultaneously with the same DNA or cDNA samples under identical conditions. Using microarrays thus provides comprehensive snapshots of the presence, abundance, and (potentially) the activity of many genes.
In general, microarrays can help to answer the following questions:
Microarray analyses are applicable to four key lines of investigation, including but not limited to:
Microarray support for site investigations is summarized in Section 6.1. Additional details regarding MNA and bioremediaton applications are provided in the following sections.
MNA can be an effective site management strategy when microorganisms capable of degrading contaminants are present. When considering MNA as a remediation strategy, nucleic acidA complex biomolecule consisting of a long “backbone” of organophosphate sugars with four different types of nucleotide bases attached.-based methods can be used to identify the presence of specific microorganisms already known to be able to degrade the contaminants. For some contaminants, a clear link between contaminant biodegradation and the presence of specific microorganisms or functional genes has been established, and EMD tools including both microarrays and quantitative PCR (qPCR) can be useful to determine and quantify the presence of the contaminant-degrading microbes. When evaluating sites for the potential to degrade contaminants with undefined degradation pathways (i.e., the genes encoding the pathway are not known) and contaminant-degrading microorganisms have yet to be identified, broad-spectrum microarray such as the Phylochip or GeoChip can potentially provide insights into the microorganisms and the functional genes involved in biodegradation. Microarrays thus establish an additional line of evidence (in addition to traditional contaminant concentration and geochemistry data) that can be used to establish links between microbial contaminant detoxification and effective cleanup strategies.
Microarray analysis may provide benefits when applied to mixed waste contaminated sites or sites with co-mingled plumes where a more comprehensive view of the microbial community is needed to assess MNA. For example, consider an industrial facility impacted by a mixture of chlorinated solvents and heavy metals. Under such a scenario, the feasibility of MNA or bioremediation as a remedial strategy will depend on the presence of several different microbial groups capable of degrading the major contaminants (PCE and TCE), co-contaminants (chlorinated ethanes and chlorinated methanes), and the resulting intermediate products. In addition, the microbiology must contribute to biological reduction of metals, which can be carried out by diverse microbial populations. The advantage of microarray application is clear under such a scenario because many target genes can be monitored simultaneously in a single analysis.
Bioremediation has two essential components - biostimulation and bioaugmentation. Biostimulation introduces a variety of additives and amendments to the aquifer to help the existing microorganisms transform and detoxify contaminants. For example, amendments for anaerobic bioremediation of chlorinated solvents include fermentable carbon substrates such as lactate, molasses, emulsified vegetable oil, slow release materials such as lactate polymers and refined plant fibers. The amendments enhance acetate and hydrogen fluxes, which serve as the direct electron donors for different chlorinated solvent-detoxifying bacteria. Amendments for aerobic bioremediation of petroleum hydrocarbons include electron acceptors such as oxygen.
Biostimulation triggers many responses of the microbial community, including relative changes in population abundances and the up-regulations and down-regulations in the expression of many genes. Microarrays that monitor many genes and transcripts simultaneously can monitor the impacts of biostimulation on the microbial community, the relative functional gene abundance, functional gene diversity, and gene activity. Such microarray measurements can document the success of biostimulation, monitor contaminant detoxification, and indicate the need for additional treatment in particular if combined with geochemical measurements. Such integrated analyses has the distinct value of reducing an over application of additives and reducing waste, secondary impacts to water quality and cost to closure.
Case Study A.10 describes a site impacted by uranium (VI). An electron donorA chemical compound that donates electrons to another compound (based on USEPA 2011)., acetate, was injected into the subsurface to stimulate in situ microbial reduction of uranium and promote sequestration. Microarray analysis provided a means to track changes in microbial community structure following acetate injection. For example, acetate injection initially stimulated aerobic and nitrate-reducing bacteria. Once oxygen concentrations decreased, metal-reducing and finally sulfate-reducing bacteria became active and increased in abundance. Microarray analysis proved to be a valuable tool for monitoring and documenting these population shifts over the course of the bioremediation project.
The application, analysis, and interpretation of microbiology-based EMD methods differ from typical soil and groundwater geochemical measurement in a number of ways. For example, microbial biomarkers cannot easily be preserved, and sample handling and processing requires special care. The analysis of microbial parameters requires specific data quality considerations for sampling plans, sample collection and handling, quality control and laboratory procedures, and these are discussed in Section 10. Included below is a brief introduction to how microarray data are typically reported and some specific examples of how the data would be interpreted in answering the questions presented in Table 2-3.
Currently, a standard format for reporting microarray results obtained with environmental samples has not been adopted, but has been advised (Brazma et al. 2001). The analytical laboratory must have established Standard Operating Procedures (SOPs) that are uniformly applied to all samples, and a report should include information about sampling (location, methodology, handling, storage) and sample processing (such as nucleic acid extraction, labeling, reverse transcriptionThe first step in activation of a biochemical pathway where a complementary RNA copy is synthesized from a DNA sequence., hybridization conditions). Microarray data are most informative when samples collected over temporal and/or spatial scales are compared to each other. As discussed elsewhere in this document, samples must be collected using the same methodology so that the microarray data obtained for different sampling events can be directly compared. The report should include information about the type of microarray used (e.g., a list of the all target genes) and document the differences in community structure and functional gene content and abundance (DNA microarrays), and gene activity (expression microarrays).
Included in Table 6-2 below is information that should be provided in laboratory reports of microarray EMD data including common laboratory report information, recommended information about the microarray method, and desirable information about the microarray method and results.
Additional information regarding sample handling and collection can be found in Section 10.
Microarrays come in many sizes; low-density microarrays may have as few as 20 probes (a specific nucleic acid sequence) while others have several hundred thousand. Because of this range of sizes, microarrays can generate a large amount of data, which can complicate in-depth data interpretations. Because it is practically impossible to empirically develop and validate hundreds or thousands of probes against all possible environmental targets represented by an array (let alone all of the unknown nucleic acids in an environmental sample), individual probes are simply potential indicators of the cognate gene or organism.
Microarrays provide qualitative (presence or absence) and semi-quantitative information. Overall shifts in microbial community structure, functional gene abundance, and expression patterns can be easily displayed and interpreted via visual data tools; however, correlated samples are recommended for interpreting microarray data, in that it is the relative change in probe A versus probe A across the correlated sample set that carries the most biological or ecological information. That is, a comparison of the same probe on the array is compared to the same probe on the array over space or time (a correlated sample set). Interpreting microarray field data may require several levels of granularity, from fine-scale analysis of individual probe responses to summed intensities over genera to integrated intensities over wells and the entire site.
Since microarrays can perform many genetic tests in parallel, data reduction and statistical procedures may be required to extract meaningful information. While such approaches are now routinely applied in the medical field, standardized microarray data analysis pipelines and reporting formats for environmental microarray data sets is in its infancy. Since the demand for environmental microarray applications is expected to increase, the support structure for microarray application to environmental samples and associated data analysis pipelines and a robust framework for data interpretation are now becoming available.
Depending on site needs, microarray analysis may also be substantially simplified when reduced data sets are used or global pattern analysis is performed. For example, a functional gene analysis focused only on the relevant reductive dehalogenaseAn enzyme that catalyzes the removal of a halogen atom from an organic compound. genes may be appropriate at chlorinated solvent sites where anaerobic bioremediation has been implemented. Such a focused analysis based on a reduced microarray dataset may be sufficient for monitoring of chlorinated solvent bioremediation, and the examination of other functional genes included on the microarray may not be needed.To illustrate interpretation of microarray results, each of the questions relevant to microarrays posed in Table 2-3 is discussed.
A) Are contaminant-degrading microorganisms present?
Microarrays can be used to target16S rRNA genes to evaluate the presence or absence of specific contaminant-degrading microorganisms. Microarrays can also be used to target functional genes encoding pathways involved in the degradation of a particular contaminant. As an example, at a site PCE and intermediate products TCE, DCE, and VC are present. Since microarrays can perform hundreds of parallel genetic tests in one assay, investigators could determine if any known dechlorinating bacteria are present by using 16S rRNA probes. Investigators could also use microarrays to verify the presence of pathways encoding specific contaminant degradation using structural gene targets (e.g. enzymesAny of numerous proteins or conjugated proteins produced by living organisms and facilitating biochemical reactions (based on USEPA 2004a). that catalyze reductive dechlorination). This resulting information could then be integrated with geochemical and contaminant data to provide a complete picture of the ongoing processes in the aquifer.
B) Are contaminant-degrading microorganisms active?
Microarrays can be used to determine if contaminant-degrading microorganisms are active. In order to accomplish this, RNA as opposed to DNA is extracted and then processed (converted into complementary DNA) for the microarray analysis. As an example, at a site PCE and intermediate products TCE, DCE, and VC are present. Investigators could verify the activity of dechlorinating bacteria by extracting RNA and analyzing the resultant cDNA targeting dechlorination pathways (e.g. enzymes that catalyze reductive dechlorination) via the microarray. These results would be supplemental to the contaminant concentrations trends data.
C) Are the microorganisms capable of complete degradation?
Microarrays can be used to assess if microorganisms are capable of complete degradation if the structural genes for the pathways of complete degradation are known. Using the example a site with PCE and intermediate products TCE, DCE, and VC, there are known structural genes responsible for steps along the reductive dechlorination pathway, and the final step (e.g. bvcA and vcrA) that code for the VC reduction to ethene.
H) Are the numbers of contaminant-degrading microorganisms and/or genes changing?
Microarrays measure the presence or absence of target genes, and the analysis of samples collected over temporal or spatial scales can indicate if genes of interest are increasing or decreasing in abundance. As stated earlier, correlated samples are recommended for interpreting microarray data, since it is the relative change in probe A vs. probe A across the correlated sample set that carries the most biological or ecological information. For a site, array data could be correlated across the monitoring wells and time to discover where and what microorganisms or structural genes are present and in what relative proportions.
I) Is the remediation strategy affecting the numbers or types of contaminant-degrading microorganisms?
This question is addressed through the same approach described for the previous question, only varying with the remediation strategy in addition to space or time. If a carbon donor is being applied at the site with PCE, one would expect to see an increase in organisms, enzymes, and expression concomitant with that action. Since arrays can provide hundreds or thousands of genetic tests in a single analysis, they can be used to develop an overall picture of what is occurring in the microbial community.
J) Is there a biological basis for intermediates accumulating?
Microarray data can provide forensic information about the absence or relatively low number of bacteria otherwise needed to complete a degradation pathway. For the site with PCE, arrays could be used to diagnose that microbes capable of dechlorinating VC to ethene were either not present or were in very low abundance. Microarrays could also be used with RNA to investigate whether enzymes that code for specific reductive dechlorination reactions were active.
O) Does the microbial community compositionDescription of the types or identities of microorganisms present in a sample. support the remediation strategy?
Microarrays are the only EMD uniquely positioned to provide thousands of data points on the microbial community simultaneously. The information produced by microarray analysis can be used to support the remediation strategy by confirming the presence of known degraders and structural degradation pathways. For the site with PCE, array analysis can provide a very in depth analysis of literally thousands of specific microbial species (e.g. all known dechlorinators) or structural genes (reductive or other dechlorination pathways).
P) Do contaminant-degrading microorganisms continue to be sufficiently abundant?
Samples collected over temporal or spatial scales can indicate if genes of interest are increasing or decreasing in abundance. For the site with PCE, array data could be correlated across the monitoring wells and time to discover where and what dechlorinators or structural genes are present and in what relative proportions. These data should also be analyzed in conjunction with geochemical and contaminant data to provide a complete assessment of remedial efforts.
Q) Are contaminant-degrading microorganisms remaining active?
This question is answered by relative gene abundances using DNA results from the arrays or directly by using RNA.
R) Is there a biological basis for intermediates accumulating?
Microarray data can provide forensic information about the absence or relatively low number of bacteria otherwise needed to complete a degradation pathway. For the site with PCE, arrays could be used to diagnose that microbes capable of dechlorinating VC to ethene were either not present or were in very low abundance. Microarrays could also be used with RNA to investigate whether enzymes that code for specific reductive dechlorination reactions were active.
EMD data provide relevant lines of evidence that microbial processes contribute to contaminant concentration reductions and to achieving the applicable closure levels. EMD data can reveal whether biodegradation processes are occurring, have sufficiently proceeded, are likely to continue, or if microbial activity will not be a major contributor to contaminant attenuation. Microarrays are suitable EMD tools to provide information about the current status of the microbial community and its activity and can provide some information about a site’s trajectory with regard to decreasing contaminant concentrations. Thus, at sites that are nearing the concentration-based goals for site closure, with limited information about natural attenuation mechanisms, microarray application can provide crucial information about the microbiology and its role for continued contaminant attenuation.
W) Is contaminant degradation likely to continue?
In order to determine if degradation is likely to continue, there may be parameters required in addition to microbial community composition and population information like that provided by arrays. As an example for chlorinated solvent degradation it would be critical to understand organic carbon dynamics, and for hydrocarbons the availability of terminal electron acceptorsCompounds used by microorganisms to support respiration. In aerobic organisms the terminal electron acceptor is oxygen (O₂). Anaerobic organisms use compounds other than O₂. These include common naturally–occurring compounds such as nitrate (NO₃⁻) or sulfate (SO₄²⁻) or anthropogenic contaminants such as chlorinated ethenes (e.g. perchloroethylene). Atoms from electron acceptors are typically not incorporated into biomolecules made by organisms that reduce these compounds during respiration.. These parameters are used to build a conceptual narrative or in some cases used as model inputs. Array data can be integrated with these geochemical parameters to provide a more complete picture of contaminant degradation and answer the question if that degradation is likely to continue. The answer to these types of questions can be complicated and no one type of data can stand alone.
AA) Does the microbial community composition suggest that sufficient contaminant degradation has occurred?
To date, microarrays have seen limited application for site assessment and bioremediation monitoring (He et al. 2011; Zhou et al. 2011; Chandler et al. 2010). The reductive dehalogenase (RDase) array contains probes targeting many of the known DehalococcoidesDehalococcoides is a genus of organohalide-respiring bacteria (for example, bacteria that use chlorinated solvents as metabolic electron acceptors) within the phylum Chloroflexi, in the domain Bacteria, and currently represented by a single species, Dehalococcoides mccartyi (Dhc). This species is the only one known with strains that dechlorinate dichloroethenes (DCEs) and vinyl chloride (VC) to ethene and inorganic chloride. (Dhc) RDase and hydrogenase genes and has been used to demonstrate changes in gene abundance following biostimulation treatment. Unfortunately, function has been assigned to only a few of the hundreds of RDase genes, limiting detailed functional analysis. At one site, groundwater samples were collected from a PCE/TCE-contaminated site from the same well prior to bioremediation and at three time points following biostimulation during the course of seven months. Total DNA was extracted and the same amounts of labeled DNA were hybridized to the RDase array.
As shown in Figure 6-2, the numbers of “bright spots” increased over time, indicating that the abundance of Dhc RDase and hydrogenase genes increased following biostimulation. In other words, this analysis demonstrates that microbes (Dhc) carrying these RDase genes multiplied in response to biostimulation. Identical DNA amounts extracted from groundwater from the same monitoring well were labeled with the fluorescent dye Cy5 and hybridized to the microarray. After washing, the slide was scanned with a laser at a wavelength of 635 nm and red fluorescence was recorded. A red signal indicates the presence of a target gene in the sample and the color intensity can be used to infer relative abundance.
These data demonstrate the utility of the RDase microarray for monitoring Dhc populations at sites undergoing bioremediation. Since Dhc strains can only grow with the chloro-organic contaminants as electron acceptorA chemical compound that accepts electrons transferred to it from another compound (based on USEPA 2011). and hydrogen as electron donor, the detection of fewer target genes or a decrease in color intensity without reaching contaminant cleanup goals may suggest that Dhc activity is limited by electron donor availability. Thus microarrays may be a powerful tool to determine if additional electron donor additions are needed and guide decision-making.
Figure 6-2. Microarray visualization of DNA samples from a chlorinated solvent contaminated site prior to bioremediation and at three time points following biostimulation.
Source: E. Padilla-Crespo and F. Löffler, Ph.D., University of Tennessee, 2012. Used with permission.
Among the genes that increased in abundance after biostimulation were RDase genes with assigned function such as the pceA gene implicated in PCE/TCE-to-cis-DCE reductive dechlorination, tceA responsible for TCE-to-VC reductive dechlorination, and vcrA and bvcA implicated in VC reductive dechlorination. Figure 6-3 below, depicts the relative increase in the abundance of pceA, tceA, vcrA, and bvcA genes, determined with the RDase microarray. The gene abundance was calculated by taking the SNR (signal to noise ratio) of “x” spot at time TX and divided by the values of that spot at T0; this value is then “a fold change in SNR”. A targeted qPCR approach could then be used to enumerate the RDase genes of interest and more accurately measure gene abundances. The intensity values of all probes targeting RDase genes with assigned function (pceA, tceA, vcrA, and bvcA genes) were individually grouped and averaged. For example, the microarry included probes targeting the pceA genes included genes of Sulfurospirillum, Dhc, Desulfitobacterium, and Geobacter spp.
Figure 6-3. Relative RDase gene abundance detected with the RDase microarray. Error bars represent the standard error.
Source: E. Padilla-Crespo and F. Löffler, Ph.D., University of Tennessee 2012. Used with permission.
Information about sampling considerations and protocols is presented in Section 10.
For microarray groundwater sampling, 1 liter groundwater samples can be shipped directly to the laboratory. In-field filtration can greatly reduce shipping costs and is highly recommended. Another mode of collection is to use colonizable surfaces on passive collection devices that can be deployed in a well, such as the BioTrap®.
A time-dependent colonizable system gives an integrated result over time. Prior to sampling, the well should be purged in accordance with regulatory guidelines and standard operating procedures. For Sterivex® the inlet of the cartridge is attached to the pump tubing (1/4 to 5/16 in. inner diameter) using a Luer-Lock® and a hose clamp. The filter is placed in a receiving container so that the volume of water filtered can be measured and recorded. In general, 1 to 2 liters should be filtered for microarray analysis. After sample collection, cap the filter on both ends, place in a Falcon™ or other tube, label appropriately, and place on ice.
Soil and Sediment Sampling: For microarrays, soil and sediment samples are typically collected in sterile Whirl-Pak™plastic bags or plastic containers. Microarrays need a minimum of 2-5 micrograms of DNA; otherwise the sample must be amplified prior to analysis.
The advent of microarray applications in bioremediation monitoring programs is just beginning, and the examples cited here indicate the potential value of microarrays for successful remediation of contaminated sites. As with all of the EMDs, an understanding of the site contaminant concentrations and trends is important and the microarray data are used as supplemental information to answer questions that are not answered with traditional data. A standardized framework for reporting microarray data is needed, which will facilitate microarray data interpretation and linking microarray information with bioremediation processes.
Microarrays allow the simultaneous detection of tens of thousands to millions of target genes in a single analysis. A powerful application is the comparative analysis of samples collected over temporal scales from the same locations, which can reveal global shifts in gene abundance and gene activity (if expression arrays are used). Microarrays are highly adaptable platforms, and probes for new phylogenetic and functional genes can be readily added to existing microarrays to expand the applicability of the technique to a broader range of microorganisms and biodegradation pathways of interest.
One limitation of the microarray technology is limited sensitivity for targets present in low abundance. An amplification step can be included; however, this step adds to the cost and an unbiased amplification of all DNA in an environmental sample is difficult to achieve (Vora et al. 2004; Gao et al. 2007). Other shortcomings of the microarray approach include a narrow dynamic range for quantification (i.e., only semi-quantitative information can be obtained for the most abundant gene targets) and cross-hybridization issues (i.e., false positive signals are generated). These limitations are particularly problematic when applied to nucleic acids derived from environmental samples.
The scientific literature has reported on a variety of microarrays specifically designed to address individual research questions from pathogen detection in clinical (Wong et al. 2007) and microbial ecology applications (Vora et al. 2004; Gentry et al. 2006). Microarray design and target choice greatly influences the quality and clear interpretation of hybridization results and affects the utility of the array for the analysis of environmental samples. Microarrays that specifically address questions of importance for bioremediation have not been commercialized yet, and the meaningful interpretation of microarray data requires experience in performing the appropriate quality control and standardization of the approach.
If the target genes are present in sufficient abundance, microarrays provide excellent qualitative results and can determine whether or not a gene is present. Although recent studies have demonstrated relationships between signal intensity and target gene abundance, at this time the dynamic range is limited, and only semi-quantitative information can be obtained.
Probes are based on known gene sequences; hence, novel or as yet undiscovered genes cannot be detected. Since the gene content in environmental samples is unknown, cross-hybridization (i.e., gene fragments unrelated to the targeted gene function hybridize to the probe) can lead to false-positive signals and erroneous conclusions.
The scientific literature has reported on a variety of different microarray designs to address specific research questions. Microarray design greatly influences the quality and clarity of the hybridization results, and affects the utility of the array for the analysis of environmental samples. The meaningful interpretation of microarray data requires experience and may not be easily accomplished, in particular with environmental samples. Currently, few microarrays relevant to environmental monitoring and bioremediation are commercially available, and standardized pipelines for data analysis and results interpretation have yet to be developed. Efforts to make microarray technology more accessible for environmental applications are underway.
Finally, microarrays provide information about many genes and can facilitate the identification of indicator genes for the process of interest at a given site. For example, microarray application may attribute transformation of the primary contaminant to a specific reductive dehalogenase gene. A more targeted follow-up analysis with qPCR will provide more detailed information about the abundance of this gene and, if combined with RT-qPCR, detailed information about gene activity can be obtained.
Further reading on microarrays is provided in Appendix F.